

Where to find Billing Overview
Click Billing Overview in the left sidebar of your white-label admin, under the SETTINGS section.The summary cards
The top of the page shows four summary metrics for the selected date range: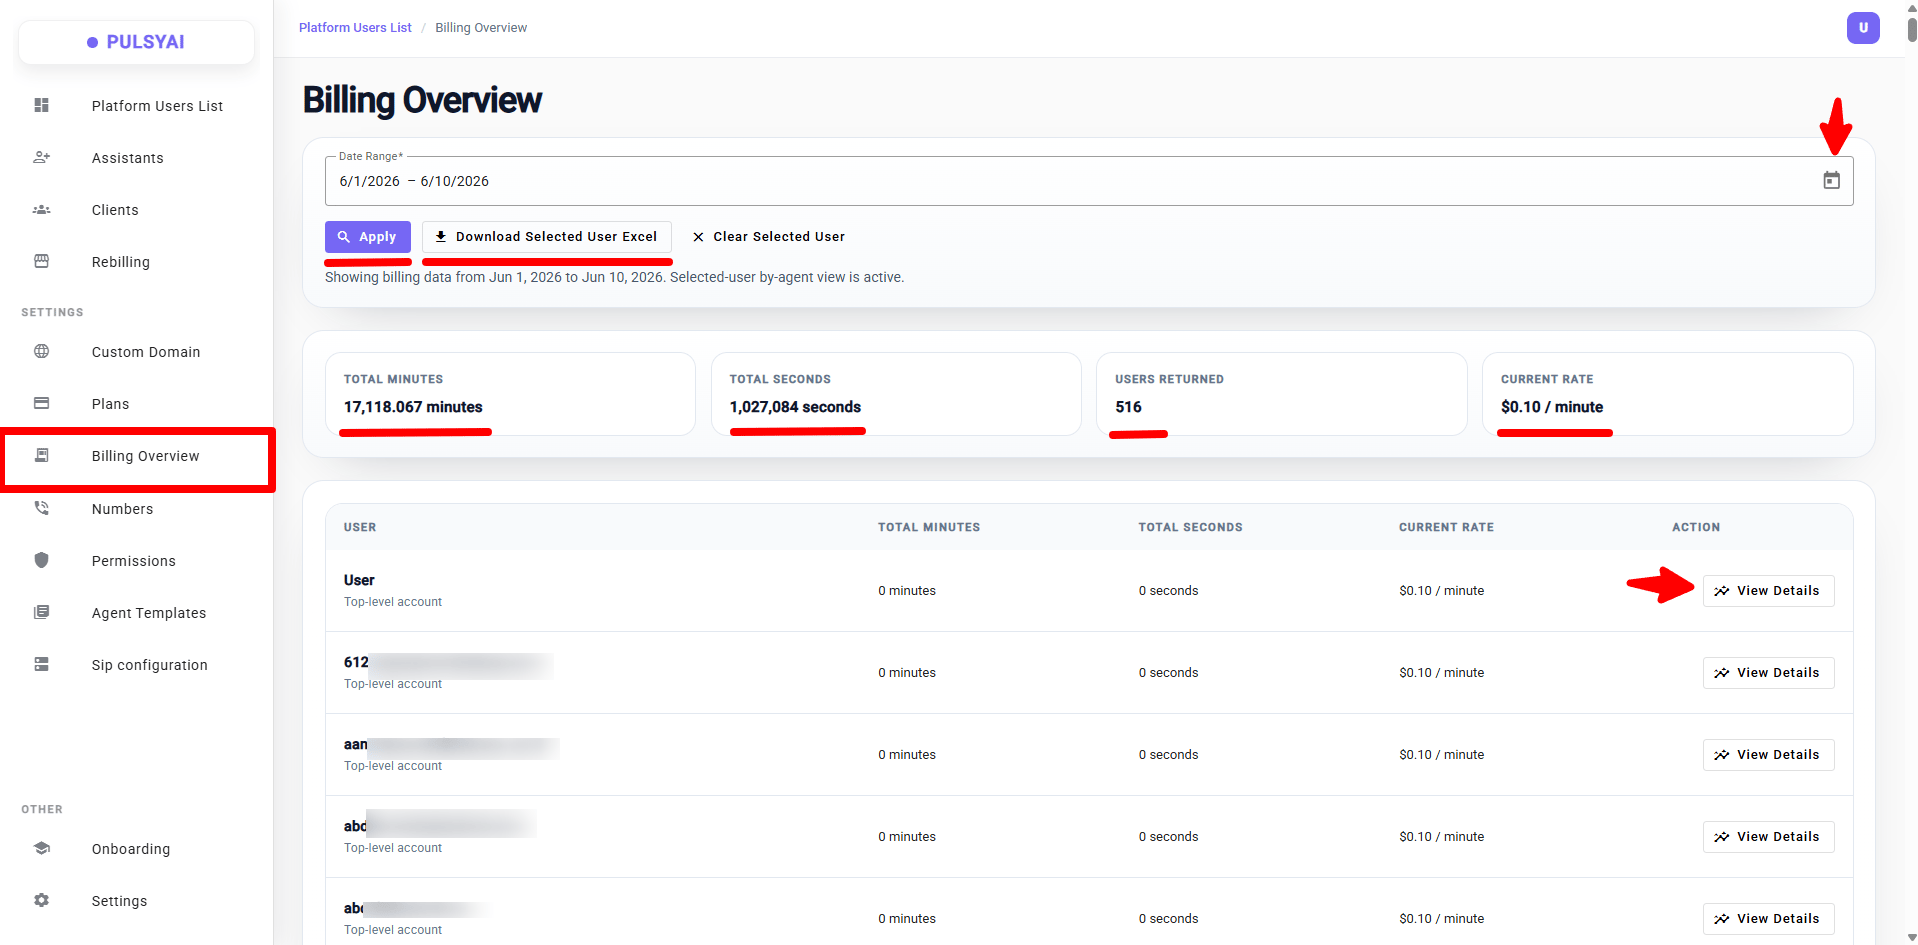
- Total Minutes — The total minutes consumed across every account visible to you for the selected date range.
- Total Seconds — The same usage expressed in seconds, useful for precise billing calculations.
- Users Returned — The number of accounts included in the current view. Use this to confirm the scope of what you’re seeing.
- Current Rate — The per-minute rate currently applied to your accounts’ consumption.
Filtering by date range
Use the Date Range picker at the top of the page to choose any start and end date for the data you want to see. Click Apply to refresh the dashboard with the new range. The page header confirms the active range below the picker — for example, “Showing billing data from Jun 1, 2026 to Jun 10, 2026.” You can shift the range at any time to compare consumption month over month, quarter over quarter, or for any custom window you need.The user list
Below the summary cards, the user list breaks down consumption per account. Each row shows:- User — The account’s email address, with a “Top-level account” label indicating its position directly below you in the hierarchy.
- Total Minutes — The minutes that account consumed during the selected range.
- Total Seconds — The same value in seconds for precision.
- Current Rate — The per-minute rate applied to this account.
- Action — A View Details button that opens the per-user drill-down modal.
Per-user drill-down
Clicking View Details on any row opens a modal with a full breakdown for that single account.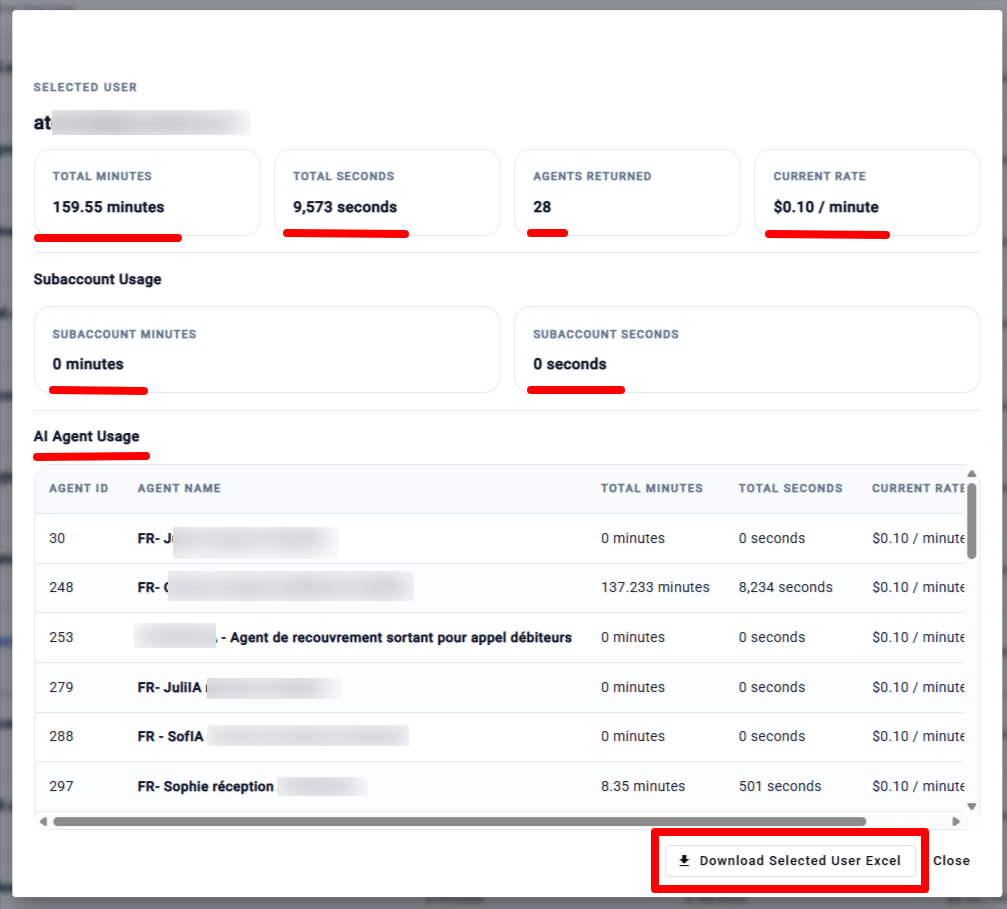
User-level summary
The top of the modal repeats the four summary metrics — Total Minutes, Total Seconds, Agents Returned (the number of AI agents the user has built), and Current Rate — scoped to this single account.Subaccount usage
The Subaccount Usage section shows how much of this user’s total consumption comes from their own subaccounts. This is critical for resellers and master partners — it lets you see, at a glance, how much usage is being generated by the user’s downstream clients versus the user’s own activity.AI Agent usage
The AI Agent Usage table lists every AI agent built on the selected account, with per-agent consumption stats:- Agent ID — The agent’s unique identifier.
- Agent Name — The display name of the agent.
- Total Minutes — Minutes consumed by this specific agent during the selected range.
- Total Seconds — The same value in seconds.
- Current Rate — The applicable rate.
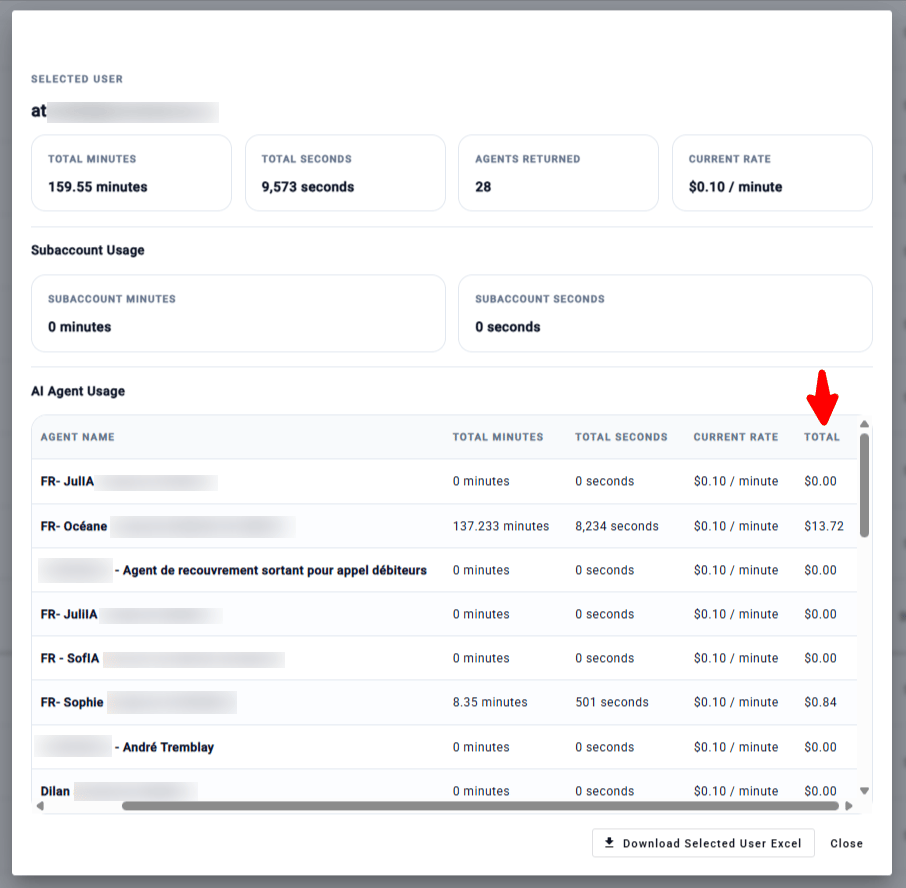
- Total — The dollar amount this agent generated during the range (calculated as Total Minutes × Current Rate). For example, an agent with 137.233 minutes at $0.10/minute shows a Total of $13.72.
Excel exports
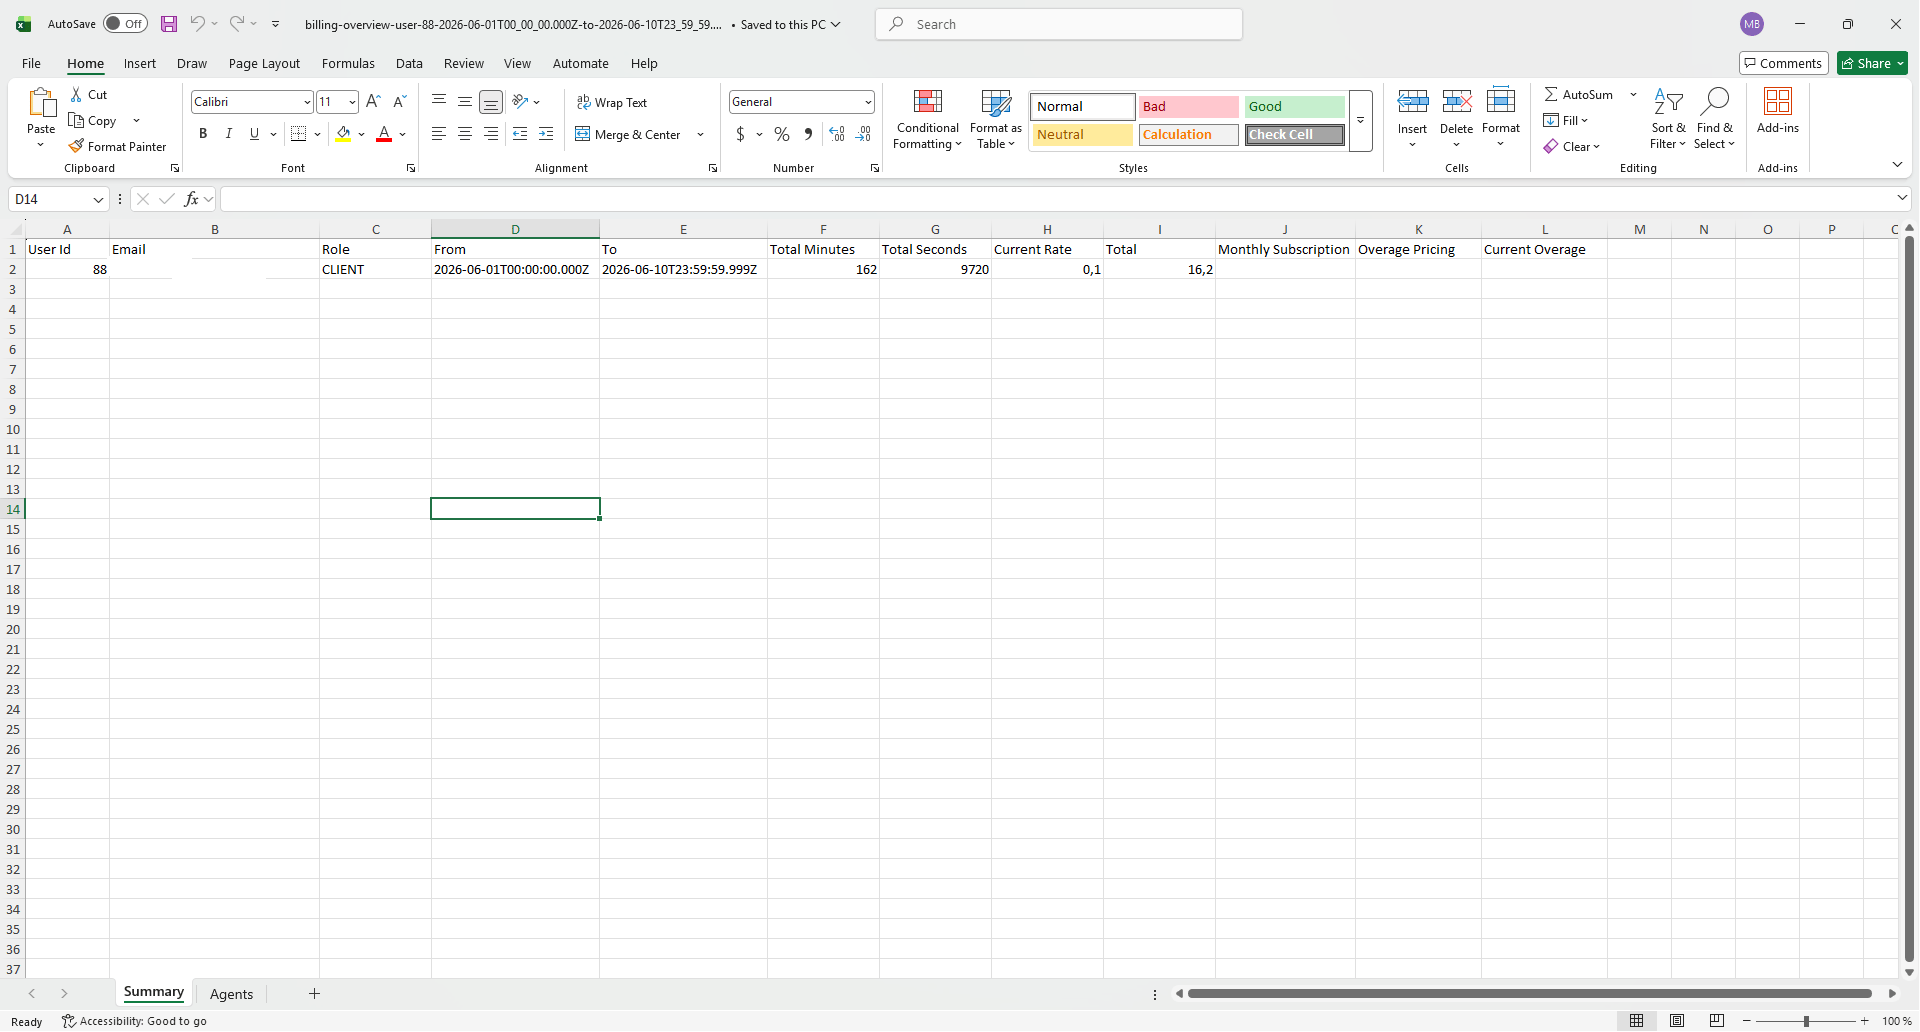
Billing Overview supports two levels of Excel export:- Download Scope Excel — Exports the entire current user list (all rows visible in the selected date range). Useful for monthly reporting, accounting reconciliation, or bulk analysis.
- Download Selected User Excel — Inside the View Details modal, exports the detailed data for one specific user and their AI agents.
Use cases
Billing Overview serves several operational needs depending on your tier in the PulsyAI hierarchy: For resellers:- Reconcile monthly platform consumption against what you bill your end-clients.
- Identify your highest-consumption clients to inform pricing conversations or plan upgrades.
- Track which AI agents on a specific client’s account are generating the most usage — useful when a client asks why their bill is high.
- Avoid surprise PulsyAI invoices by monitoring real-time consumption and acting on outliers before month-end.
- Track consumption across every sub-reseller beneath you in the hierarchy.
- Drill into any sub-reseller to see their individual end-clients’ usage patterns.
- Forecast platform costs and revenue at the partner-program level.
- Monitor consumption across all resellers in real time.
- Identify accounts approaching unusual thresholds for proactive outreach.
- Reconcile platform-wide consumption for internal billing and capacity planning.
Next step
Permissions
Configure role-based access for your team members operating the PulsyAI platform.