> ## Documentation Index
> Fetch the complete documentation index at: https://docs.pulsyai.com/llms.txt
> Use this file to discover all available pages before exploring further.
# Analytics
> Track call volume, outcomes, conversion rates, and agent performance with built-in PulsyAI analytics dashboards across inbound, outbound, and SMS agents.
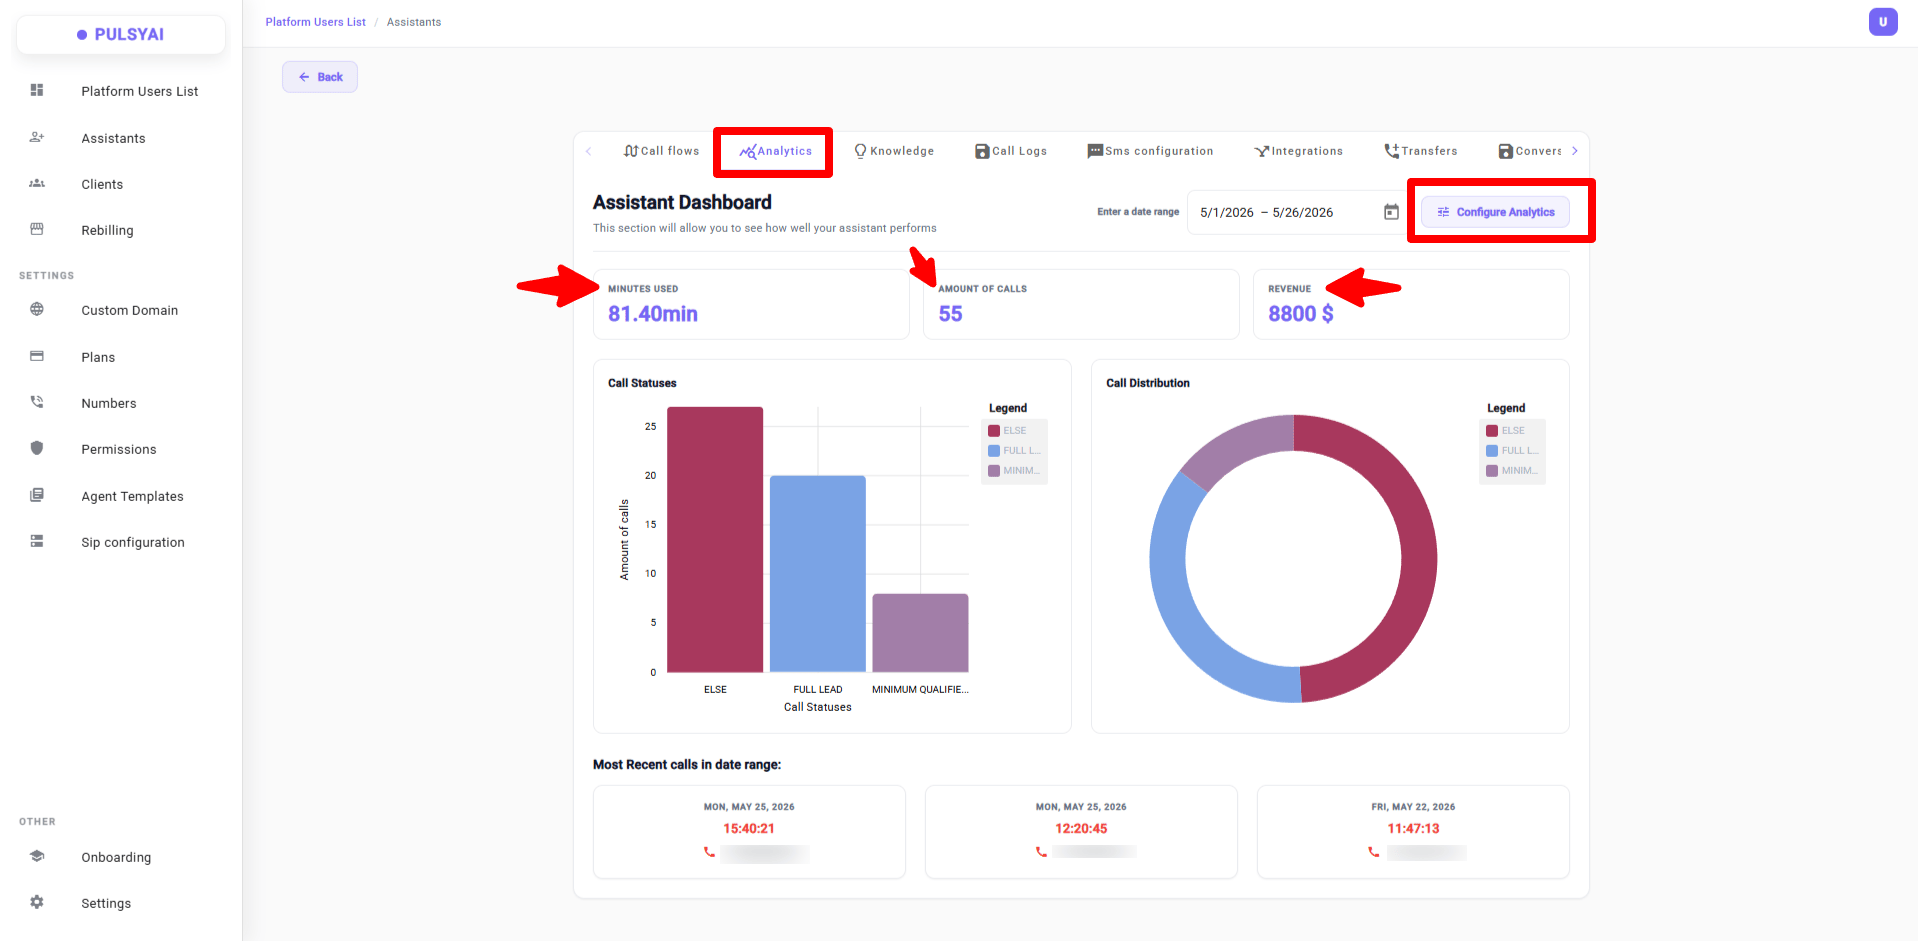
The Analytics page gives you a real-time view of how your AI voice agents are performing. It centralizes call volume, duration, outcomes, and sentiment data so you can measure results and optimize your agents without leaving the platform.
To access it, click **Analytics** in the main menu.
 ***
## Key Metrics
At the top of the Analytics page, a row of KPI cards gives you an instant snapshot of activity across your agents.
| Metric | Description |
| --------------------- | --------------------------------------------------------------------------------------------------------------------------------------------------------------------------------------------------------------------------------------------------- |
| **Total Calls** | Total number of calls handled by your AI agents in the selected period. |
| **Total Minutes** | Cumulative call time across all agents. |
| **Avg Call Duration** | Average length of a call — useful for gauging conversation quality and agent efficiency. |
| **Revenue** | Total monetary value generated by your agent based on call outcomes. Each call is automatically classified by the AI (e.g. Full Lead, MQL, Else) and the assigned dollar value per status is summed up here. Configured in **Configure Analytics**. |
***
## Configure Analytics
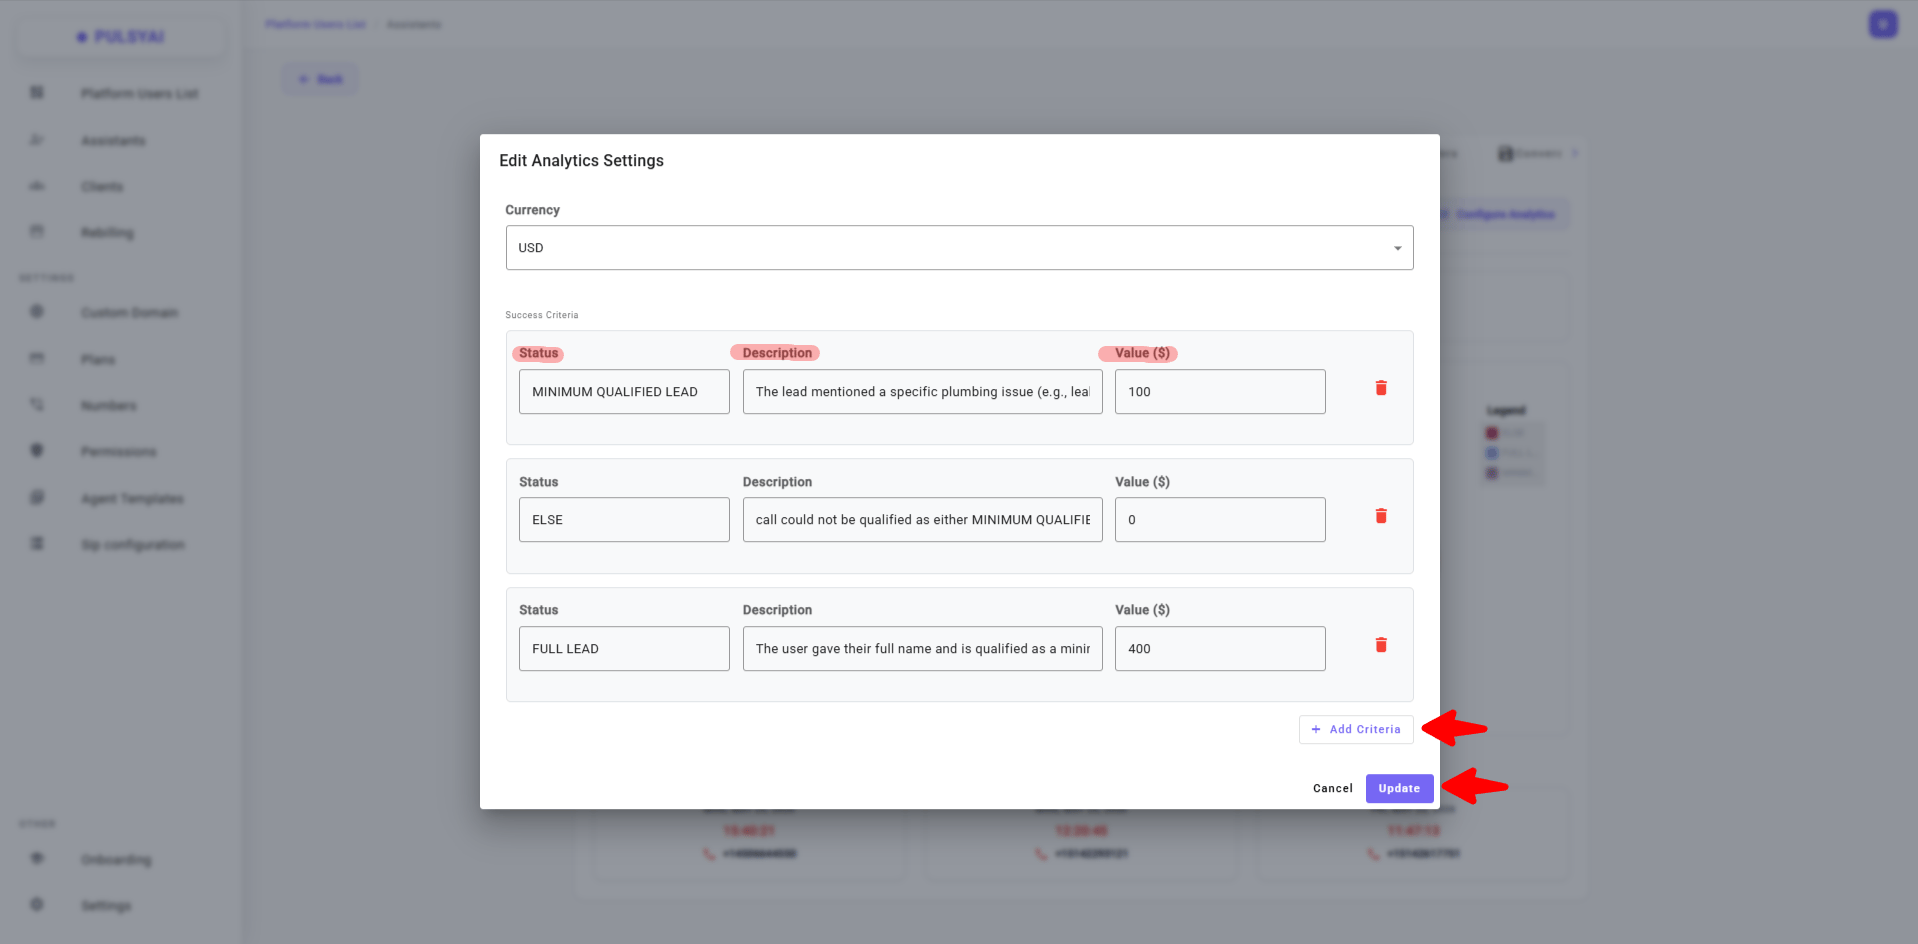
The **Revenue** metric is powered by your own custom call statuses. Click **Configure Analytics** to define what counts as a qualified lead — and what monetary value to assign to each outcome.
***
## Key Metrics
At the top of the Analytics page, a row of KPI cards gives you an instant snapshot of activity across your agents.
| Metric | Description |
| --------------------- | --------------------------------------------------------------------------------------------------------------------------------------------------------------------------------------------------------------------------------------------------- |
| **Total Calls** | Total number of calls handled by your AI agents in the selected period. |
| **Total Minutes** | Cumulative call time across all agents. |
| **Avg Call Duration** | Average length of a call — useful for gauging conversation quality and agent efficiency. |
| **Revenue** | Total monetary value generated by your agent based on call outcomes. Each call is automatically classified by the AI (e.g. Full Lead, MQL, Else) and the assigned dollar value per status is summed up here. Configured in **Configure Analytics**. |
***
## Configure Analytics
The **Revenue** metric is powered by your own custom call statuses. Click **Configure Analytics** to define what counts as a qualified lead — and what monetary value to assign to each outcome.
 ### How It Works
PulsyAI comes with default call statuses out of the box. But with Configure Analytics, you can define your own custom statuses that match your business — along with a description written as a prompt, which our AI uses at the end of every call to automatically classify the conversation.
Each status has three fields:
* **Name** — The label for the outcome (e.g. MQL, Full Lead, Else)
* **Description** — A prompt that tells the AI exactly when a call qualifies for this status
* **Value** — The dollar amount assigned to this outcome, used to calculate the Revenue metric
### Example
A plumbing business might configure their statuses like this:
| Status | Description (prompt to the AI) | Value |
| -------------------------------- | -------------------------------------------------------------------------------------------------------------- | ----- |
| **Full Lead** | The user gave their full name and is qualified as a minimum qualified lead. | \$400 |
| **MQL** (Minimum Qualified Lead) | The lead mentioned a specific plumbing issue (e.g. leak, clogged drain, water heater), confirming a real need. | \$100 |
| **Else** | The call could not be qualified as either a Minimum Qualified Lead or a Full Lead. | \$0 |
After every call, PulsyAI's AI analyzes the conversation transcript and assigns the appropriate status. The value of each classified call is then summed up to populate the **Revenue** metric — giving you a real, monetized view of what your agent is generating for the business.
You can add as many custom statuses as you need, and delete any you no longer want. Just make sure to click **Update** when you're done to save your changes.
***
## Filters & Date Range
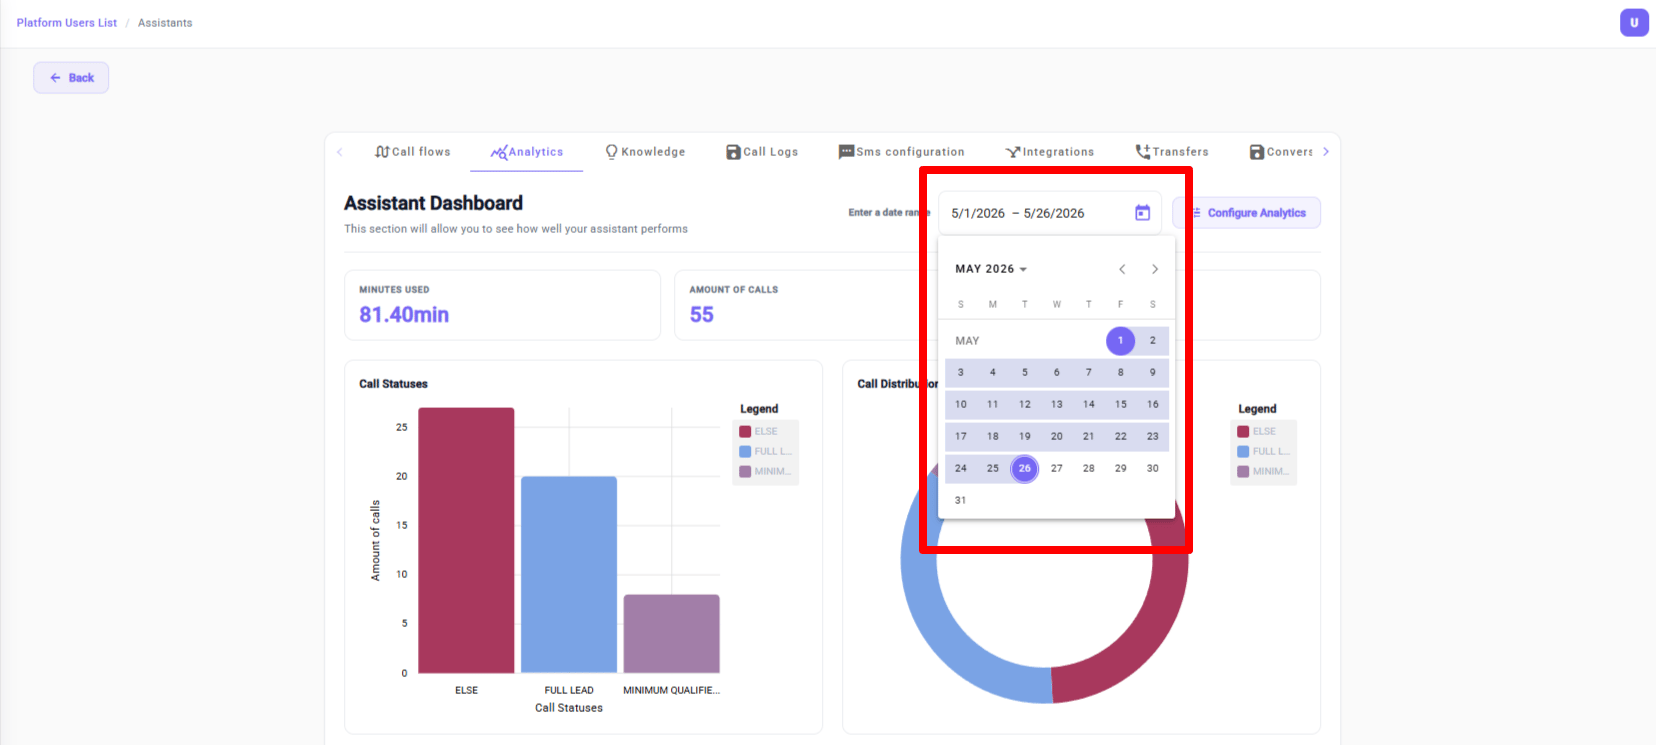
Use the date picker at the top of the page to define the time window for all metrics and charts. Select a start date and an end date to view statistics for any specific period. All KPI cards, the performance chart, and the call logs table update based on the selected range.
You can filter by **Assistant** to view data for one specific agent at a time.
### How It Works
PulsyAI comes with default call statuses out of the box. But with Configure Analytics, you can define your own custom statuses that match your business — along with a description written as a prompt, which our AI uses at the end of every call to automatically classify the conversation.
Each status has three fields:
* **Name** — The label for the outcome (e.g. MQL, Full Lead, Else)
* **Description** — A prompt that tells the AI exactly when a call qualifies for this status
* **Value** — The dollar amount assigned to this outcome, used to calculate the Revenue metric
### Example
A plumbing business might configure their statuses like this:
| Status | Description (prompt to the AI) | Value |
| -------------------------------- | -------------------------------------------------------------------------------------------------------------- | ----- |
| **Full Lead** | The user gave their full name and is qualified as a minimum qualified lead. | \$400 |
| **MQL** (Minimum Qualified Lead) | The lead mentioned a specific plumbing issue (e.g. leak, clogged drain, water heater), confirming a real need. | \$100 |
| **Else** | The call could not be qualified as either a Minimum Qualified Lead or a Full Lead. | \$0 |
After every call, PulsyAI's AI analyzes the conversation transcript and assigns the appropriate status. The value of each classified call is then summed up to populate the **Revenue** metric — giving you a real, monetized view of what your agent is generating for the business.
You can add as many custom statuses as you need, and delete any you no longer want. Just make sure to click **Update** when you're done to save your changes.
***
## Filters & Date Range
Use the date picker at the top of the page to define the time window for all metrics and charts. Select a start date and an end date to view statistics for any specific period. All KPI cards, the performance chart, and the call logs table update based on the selected range.
You can filter by **Assistant** to view data for one specific agent at a time.
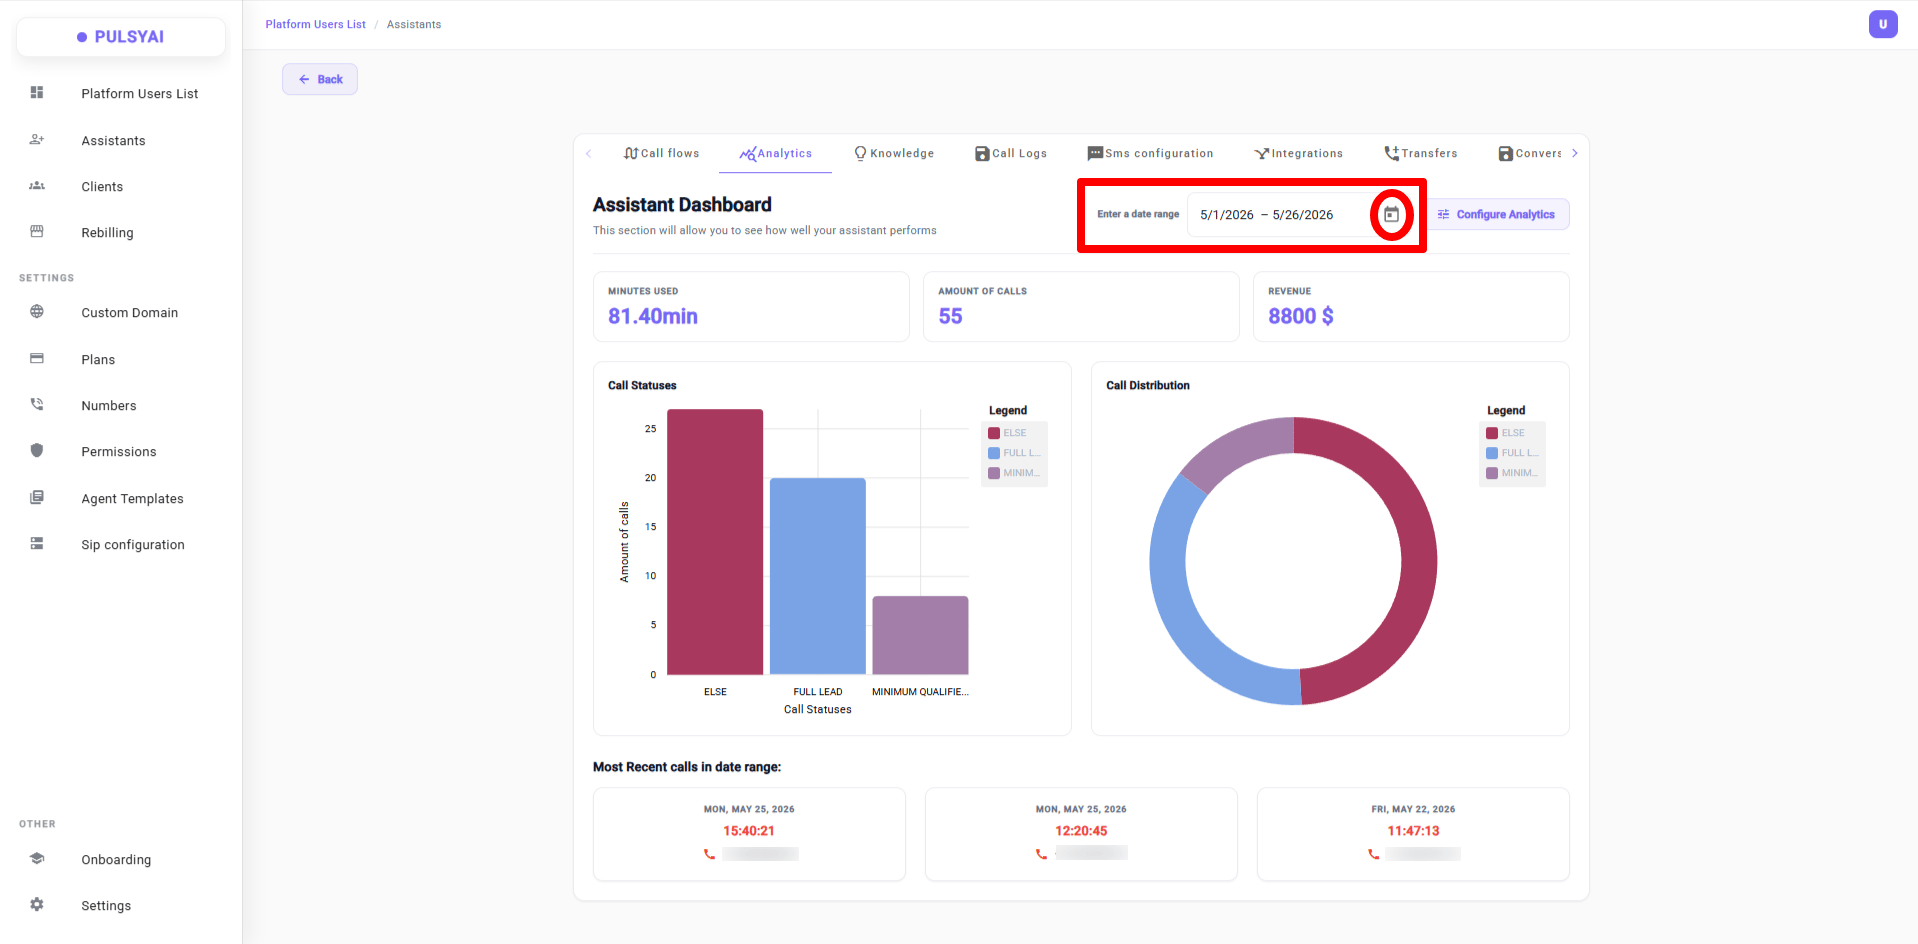 Click the calendar icon to open the full date picker — select any start and end date to filter past or current data.
 ***
## Recent Calls
At the bottom of the Analytics page, you'll see a preview of the **3 most recent calls** handled by your agent — a quick snapshot of the latest activity without leaving the dashboard.
***
## Recent Calls
At the bottom of the Analytics page, you'll see a preview of the **3 most recent calls** handled by your agent — a quick snapshot of the latest activity without leaving the dashboard.
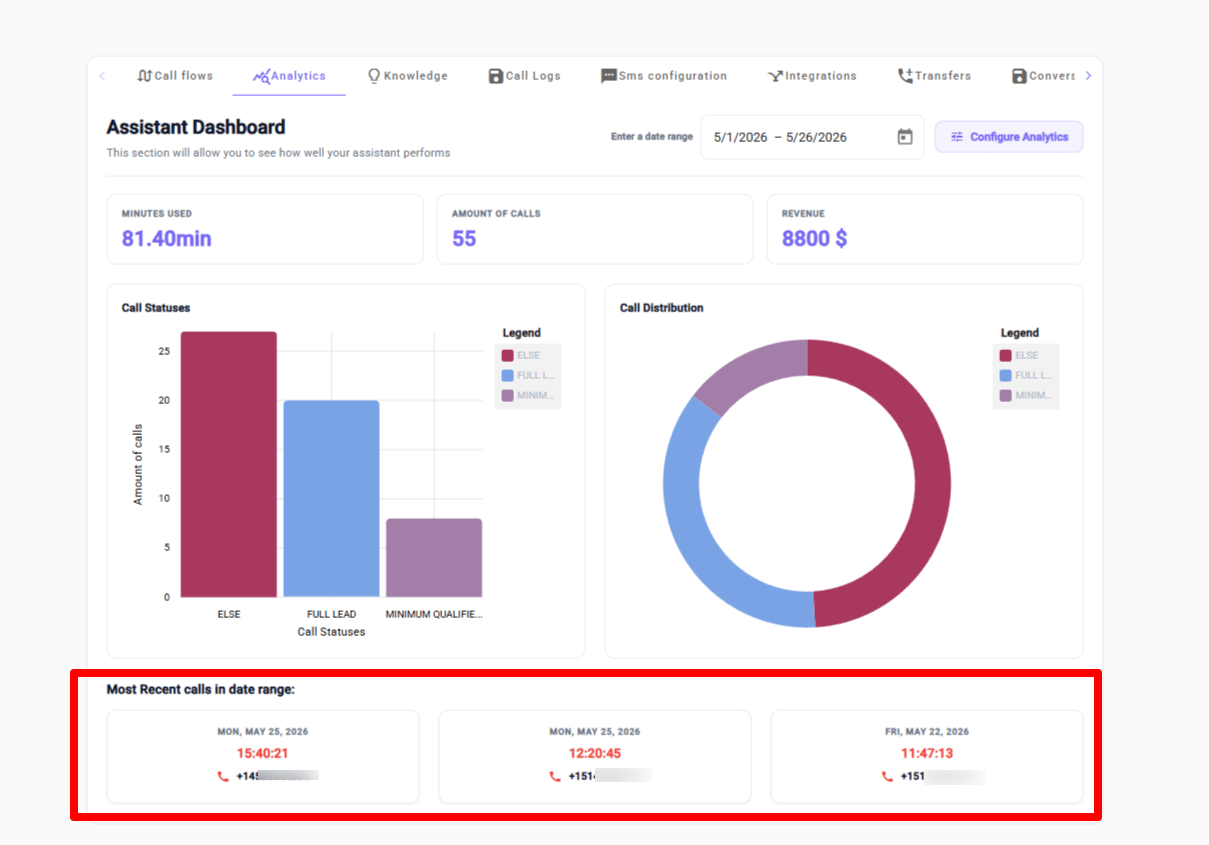 For the full history of every inbound and outbound call — with transcripts, recordings, and extracted data — see the [Call Logs](/platform/call-logs) page.
***
## Next Steps
Deep-dive into individual call records, transcripts, and recordings.
Optimize your agent scripts based on what the analytics reveal.
For the full history of every inbound and outbound call — with transcripts, recordings, and extracted data — see the [Call Logs](/platform/call-logs) page.
***
## Next Steps
Deep-dive into individual call records, transcripts, and recordings.
Optimize your agent scripts based on what the analytics reveal.